Power is out across parts of western Washington as a potent atmospheric river, fed by deep Pacific moisture, slams the region. Rivers are rising. Soils are saturated. Trees are falling into lines. I am tracking the outages and restoration work right now. The fastest way to see what is happening on your street is your local PUD outage map.
What the PUD outage map shows right now
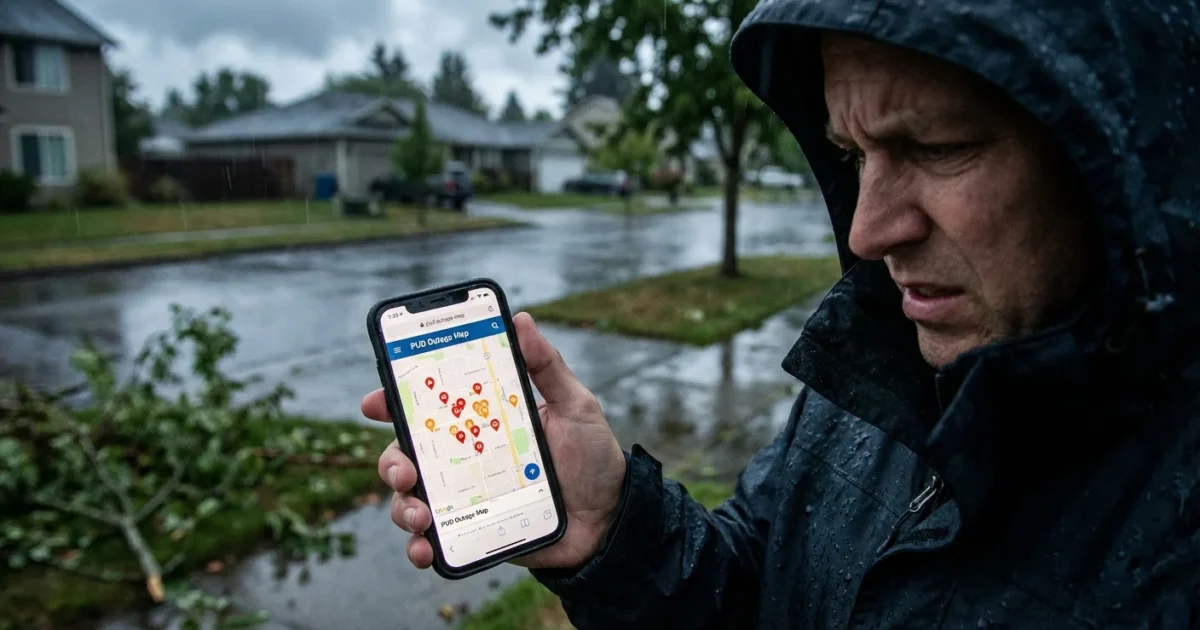
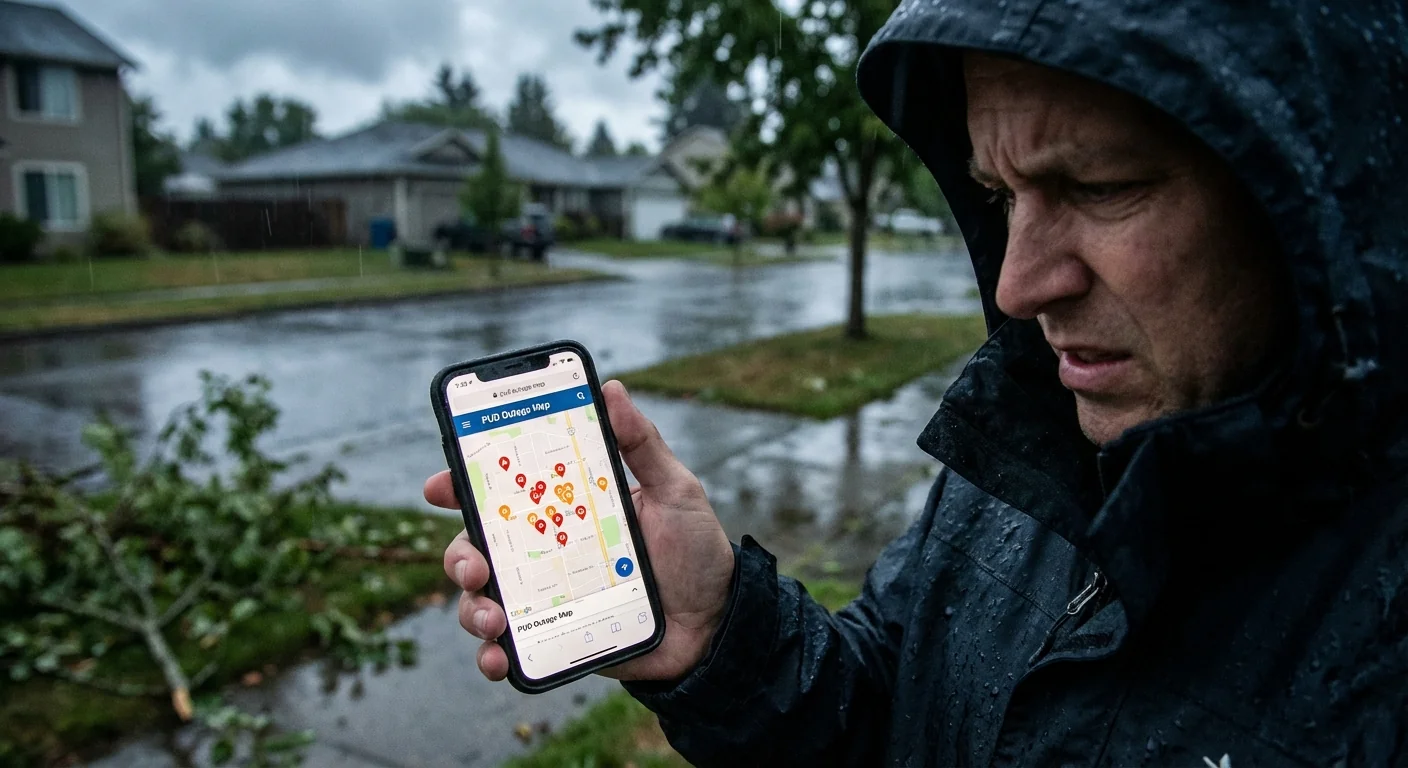
PUD outage maps display outages in near real time. You will see colored clusters that show how many customers are out. You can click a cluster for street level detail. Many maps include estimated restoration times and cause notes, like tree into line or equipment damage.
During a large storm, data can lag. Utility crews must first make the scene safe. Field assessments take time. Maps update when crews report back. Treat estimated times as guides, not promises.
Estimated restoration times can change quickly as crews assess damage, gain access, and make repairs.
Maps also show priority work. Hospitals, water plants, and roads near emergency services come first. Transmission repairs come next. Then neighborhood circuits. A single tree can take out a feeder that serves thousands. Other times, a small fuse isolates only a few homes. The map helps you tell the difference.
How to find your map fast
There is no single national PUD outage map. Each utility runs its own. In western Washington, this includes city utilities, county PUDs, and investor owned companies. Check the provider that serves your home.
- Look at your last bill or account email to confirm your utility name.
- Go to your utility’s website and find the Outage or Outage Map link on the homepage.
- Enter your address if the map offers it, then zoom to your area.
- Sign up for text or email alerts on the same page for faster updates.
Examples in the region
Snohomish PUD, Clark Public Utilities, Seattle City Light, and Puget Sound Energy each maintain maps. Some also offer outage reporting buttons, which feed the map and speed diagnosis. If your provider lists a phone number, call it to report hazards or medical needs.
Bookmark your utility’s outage map on your phone. Save the outage phone number and your account number for quick reporting.

Reading the map during this storm
Icons show the outage size and status. Gray or green may indicate crews assigned. Red, orange, or yellow often mark active outages. A lightning bolt can signal a major feeder problem. Click into the legend to learn your map’s symbols.
If your home is dark but your block shows mixed lights, it may be a blown transformer or a tripped fuse. That shows as a small, localized marker. If the map highlights a long line along a road, it is likely a feeder. That takes longer and needs tree crews to clear debris first. Flooded areas can also delay work until waters recede.
Remember the rule of restoration. Make safe, then restore the most customers, then fix smaller taps. It is not a lack of effort. It is the fastest way to bring the most people back online.
Safety and reporting
Report your outage if the map does not show it. Use the online form if available, or call the outage line. Do not assume a neighbor reported it.
Stay at least 35 feet from any downed wire. Treat every line as live. Call 911 and your utility immediately.
If power is out for many hours, protect your family and food. Run generators outdoors only. Keep fridge and freezer doors closed. Unplug sensitive electronics. Avoid floodwater, which can hide live hazards.
- Never use grills or stoves to heat a home. Carbon monoxide builds fast.
- Keep a flashlight and spare batteries ready. Avoid candles if possible.
- Charge phones and battery packs when power returns briefly.
- Check on neighbors, especially older adults or folks with medical devices.
Why this storm is so wet
An atmospheric river is a long band of moisture in the sky. Warm air holds more water. The Pacific has been running warm again, which has raised the ceiling for heavy rain. When that moisture hits our coastal mountains, it squeezes out torrents. Soils saturate. Roots loosen. Winds push trees into lines. Flooded roads block crews.
This is a climate story as well as a weather story. A warmer world loads the dice for stronger atmospheric rivers. Utilities are responding with stronger poles, more underground lines in key corridors, better vegetation management, and microgrids near critical sites. These moves help, but they take years and billions of dollars. Today’s outage maps are the real time window into that work.